How the Global indices cheat emerging and developing countries
Since the Basel Institute of Commons and Economics published the first Global Index Benchmark in 2011, another seven years passed – and nothing changed in the methodology, the bias and the unilateralism of the major indices. None of the institutions reacted to the Excel we updated in 2016 again. While journals in Development Economics and -Studies refused to publish the results, we published them within the MPRA of the Munich University: https://mpra.ub.uni-muenchen.de/74268/
In the meanwhile, a new Index entered our Global Index Benchmark, the so-called SDG Index of the German Bertelsmann Foundation. Therefore we were capable to update our Global Index Benchmark in December 2018 and here you can download the Excel.
You may quickly think: this is for experts only. Unfortunately, this is true. So when we send the results to Ministries for Development or to Development Agencies they don’t know to read it and never consider the results of course.
But there may be political reasons as well: the results of the Global Index Benchmark are questioning the entire database of the Official Development Assistance (ODA) as well as the financial instruments of the UN, the IMF, the World Bank, and the Development Banks.
We can demonstrate this with three charts.
Since decades the same 20 countries lead all Global indices. But whom does that help?
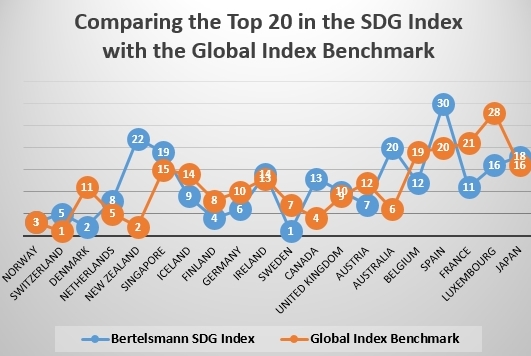
On the first chart (see image left) we see a comparison of the Top-20-countries in the Global Index Benchmark of 10 indices with their ranking in the Bertelsmann SDG Index.
While the SDG Index is composed of the same indicators the other indices use – GDP, life expectancy, education time, digitalization, health – the difference is very small – especially when we know, that 151 countries are considered in the Global Index Benchmark.
Smaller controversies in the joint scores of the indices can only be found in the cases of Australia, New Zealand and Luxembourg, that are blamed for less ecological compliance by the Happy Planet Index, that ranked e.g. Australia at rank 105 only.
We may consider as well: all the countries are OECD countries and ten of them are small countries with a population of fewer than 10 million inhabitants.
And 15 of them are direct neighbors at the northern hemisphere.
When we make the case of these findings we often hear that that’s exactly what the task of the indices and their rankings is, which is to provide the best practice for the emerging and developing countries who are the pupils in the World’s school of development. But even in school, we need common standards to assess the performance of the pupils.
Do the indices provide a common standard?
In statistics, we can assess the existence of a common standard by the mean average deviation of the scores of the ten indices. Will they agree in the same extent on the winners as well on the losers?
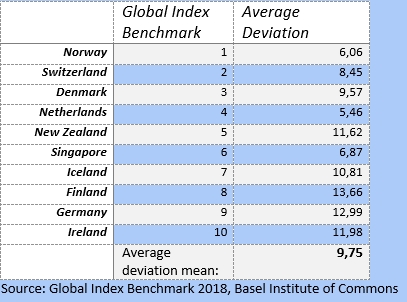
As we can see in the chart (image on the right) the average deviation to nominate the ten winners of all Global assessments is 9.75. That means: among 151 countries we include, the difference in identifying the Top-ten-countries is only 10 ranks.
By looking at the chart we may as well recognize the fact, that there is only one country with a bigger population among the top ten.
We may summarize: ‚The smaller, the better‘, which gives place to explain the societal and economic success of smaller countries by social cohesion, shared social values and perceptions and of course a high level of non-material assets such as interpersonal trust, helpfulness and the willingness to co-finance the public goods.
All these assets are indicators in the World Social Capital Monitor that will be published in March 2019 first and that you can test here: https://trustyourplace.com/
The crucial question is now: do the experts from UN, WEF, Transparency International, World Bank, IMF, and other IGOs assess the countries at the end of the ranking with the same deviation? If yes, we may criticize the outcome but had to consider nevertheless certain objectivity and rationalism in the scores.
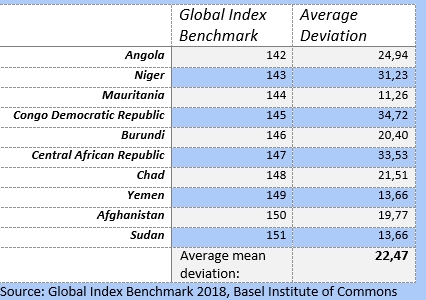
So we look at the last ten ranks of the Global Index Benchmark (image left). While there are nevertheless three countries still with an affordable mean average deviation (Mauritania, Sudan, and Yemen), the average more than doubles now from 9.75 ranks to a deviation of 22.47 ranks!
So the experts agree more whom to praise then whom to blame. While the experts, of course, come from countries among the top-twenty, we may consider: the Global indices favor a few OECD countries where they come from.
Only with this knowledge, you can explain why the Russian Federation (92) ranks three places behind! Ukraine (89), or why Turkey (81) ranks behind South Africa (77), or Brazil (62).
It’s time to throw the old indices overboard and to start assessing countries by assets they have on their own and that they can, therefore, improve by themselves.
Kommentare deaktiviert für How the Global indices cheat emerging and developing countries
admin am Dezember 30th 2018 in Allgemein